Imaging
Available
Signals
Five signal types are
available for imaging on our electron microprobe: secondary electrons,
backscattered electrons, x-ray intensity, absorbed current, and cathodoluminescence.
Descriptions of the available signals are given below, along with examples of
images and their applications for most signal types.
Secondary
Electron Imaging (SEI).
Secondary electrons are low energy electrons emitted from very near the sample
surface. This signal provides an image of the sample topography, and hence,
external morphology. This can be applied not only to simple characterization of
a sample material but also to a variety of other applications including
component failure analysis or the determination of chemical stability of
materials indicated by growth or dissolution features.
This image of natural cuprite (Cu2O) was acquired at 74x
magnification, which is near the 50x lower limit of magnification for our instrument.
It shows the general acicular to fibrous nature of the material seen at low
magnification.
This image of the same cuprite was acquired at 500x magnification, which is near
the limit of resolution by typical far-field optical microscopy. It shows the
reticulated habit of grains that appear prismatic at lower magnification.
This image of the same cuprite was acquired at 3000x magnification, which exceeds
the resolution of typical optical microscopy. It shows that grains appearing
smooth at lower magnification are coated by fine, dendritic
to radial skeletal growth.
Backscattered
Electron Imaging (BSEI).
Backscattered electrons have higher energies than secondaries,
and are produced when electrons from the primary beam are "bounced"
back out of the sample by elastic collisions with atoms. The number of
electrons a given atom will backscatter is proportional to its mean atomic
number. Materials composed of larger, heavier atoms will backscatter more electrons, producing brighter gray tones in the images than
less dense materials (differences in average atomic mass of 0.1 amu can be resolved). Backscattered electrons thus produce
an image that is related to material composition, providing both spatial and
chemical information. This signal is especially useful for characterizing
fine-grained multicomponent materials (first two
images, below) and for documenting chemical heterogeneity in single coherent
phases (third image, below).
This is a low magnification BSE image
of mortar from the brickwork of the Sarkeys energy
center. It shows the general structure of the mortar including fine aggregate
comprised of quartz (Qtz) and orthoclase (Or) sand grains plus minor hematite
(Fe2O3: white, near center of image), set in a matrix of
Ca- and Al-silicates. Note the heterogeneity within the matrix, especially with
respect to the porosity gradient from the more massive high-Ca cement at the
left to the more variable and hydrous Si-rich cements at the right.
This image is a detail from
near the of the center of the previous image, and shows heterogeneity within
the Si-rich cement defined by sequential formation of (1) early ferruginous di-calcium aluminate, followed by
(2) di-calcium silicate, and finally very hydrous
low-calcium silicates (3).
This image is of two banded tourmaline
crystals with quartz (Qtz) and orthoclase (Kfs) from a granitic rock. Banding
in the tourmaline, nominally Na(Fe,Mg)3Al6(BO3)2Si8O18(OH,F)2,
is due exclusively to variations in the Fe:Mg ratio
(the Fe-rich zones are lighter), as the molecular fractions of other components
in these crystals are essentially constant.
X-Ray
Imaging
Elemental
Distributions. X-ray intensity images document the
distribution of selected elements in a material. Therefore, they can show the
chemical basis for intensity variations observed by BSEI. X-ray images can be
acquired with either or both the WDS and EDXA detectors. Images can be
calibrated to produce quantitative elemental distribution maps, either by
automated process during acquisition or manually after acquisition if the
concentrations for two points of different intensity are known. Image output
can be in color or black/white, and color schemes for the images can be
user-defined. In the following example of a metallurgical slag, brighter colors
indicate higher intensities (red = max, black = min). The BSE image (upper
left) shows the complexity of the slag in which the four most abundant phases,
in order of decreasing average atomic mass are: (1) metallic Fe (white in BSEI:
note the high intensity in the Fe Ka image, and no intensity in the O Ka
image); (2) skeletal, apparently cubic (Cr, Mn)-oxide (light gray in BSEI: note
the high intensities in the Cr Ka image, and low intensity (blue) in the O Ka
image); (3) interstitial Cr-aluminosilicate that is probably quenched to glass
(dark gray in BSEI: note low intensity in Cr Ka image, but moderate intensity
in Si Ka and high intensity in Al Ka images) and (4) silica (SiO2)
that is likely quartz (black in BSEI, high red intensities in the Si Ka and O
Ka images.
Resolution
of phases with similar electron backscattering cross-sections.
In some cases, different phases have very similar average atomic masses, and
may be difficult or impossible to distinguish by BSEI. In such cases, even
subtle differences in composition between the phases may permit their
discrimination by x-ray imaging.
The
example below shows three images of an experimental product from a high tempeature study of crystal growth from granitic melt.
The left BSEI shows patchy intergrowth of potassic alkali feldspar ((K,Na)AlSi3O8):
white) with albite feldspar (NaAlSi3O8: medium gray) and
quartz (SiO2: medium gray) in melt that was quenched to glass
(darker gray, lower right corner of image). Because albite and quartz have very
similar electron backscattering cross sections, they are often difficult to
distinguish by BSEI. This distinction is easily made, however, by the use of
x-ray imaging. The center image is of Na distribution: the red areas are
richest in Na and, hence, are albite. The right image shows Si distribution;
the red areas are quartz which is the phase having the highest Si content in
this system.
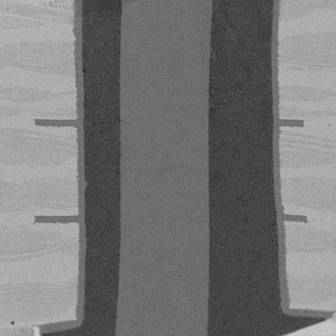
Absorbed
Current Imaging
Absorbed current images show
differences in electrical conductivity within a sample. As such, the signal can
be used to examine variations in composition or structure, especially in
conductive materials like metal alloys and electrical components like this
component socket (solder fillet) in a printed circuit board.
Image
size: 1580 x 1580 mm
Cathodoluminescence
Imaging
Cathodoluminescence (CL) is
the emission of energy in the form of light in the UV to near-IR (including the
visible wavelengths) produced by many materials when bombarded by high energy
sources, which is an electron beam in our instrument. For many or most such
substances, the color and intensity of the cathodoluminescent signal are very
sensitive to trace element chemistry and/or defects in the mineral lattice.
This makes the CL signal very useful for distinguishing zoning in crystals that
may not be resolved by optical microscopy or BSEI. This can be applied to
growth history and kinetics for many minerals or synthetic compounds,
especially as a guide to selecting points for quantitative analysis of minor to
trace level components by WDS or other laser- or ion-beam methods.
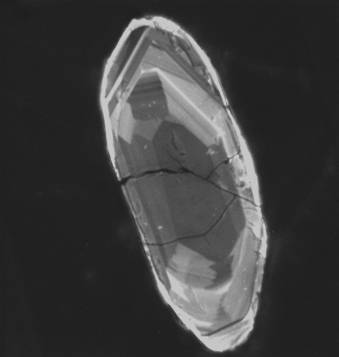
The following CL image of a
U-rich zircon crystal in epoxy was acquired in about 1.5 minutes using a 5 nA beam current. Note that lattice damage
caused by the decay of radioactive uranium diminishes cathodoluminescence intensity
in zircon, causing weak luminescence in this grain (many zones show CL
intensity comparable to, or weaker than, the surrounding epoxy).
Image
size: 287 x 287 mm
Imaging
Methods
Images, especially those
utilizing electron or absorbed current signals, are typically viewed in
live-time on a 17" display monitor much like those of standard SVGA
computer displays; two video channels are available. The rate of beam scanning
can be varied from TV rate to 12 seconds per frame. Live-time images are
typically captured directly to device independent bitmap (BMP) digital file that
provide no data loss due to image compression, but can be converted to a
variety of other formats providing great flexibility, exportability, and
opportunities for image enhancement and analysis.
Image
Enhancement, Analysis, and Output
A variety of software
packages are available for simple viewing and enhancement of digital images.
Among these Media Cybernetics Image Pro Plus® runs as an off-line solutions,
supporting intensity and spatial filtering, arithmetic operators, and text
annotation. Image Pro Plus® has significantly greater capabilities for text
annotation and image manipulation, and thus most enhancement and editing is
performed with this package using standard (TIFF, JPEG, GIF, BMP) file formats.
Quantitative image analysis
is performed using the Media Cybernetics Image Pro Plus® package. In addition
to image enhancement capabilities, this package supports a wide array of
features for deriving quantitative information from images. Among those
features are included: manual and semi-automated object measurement (size,
intensity, shape, orientation), classification, and counting, with result
analysis and statistics exportable to spreadsheets; spatial and intensity
calibrations with corrections for non-linearity; spatial, logical, arithmetic,
and background correction operations; false coloration of gray-tone images,
true 24-bit color processing of RGB images, and color-based image segmentation;
and capabilities for simultaneously working with multiple images. When used in
concert with logical (Boolean) and arithmetic operators, the latter feature can
be extremely useful for producing phase distribution maps in complex
multi-component systems from combinations of x-ray intensity and backscattered
electron images.
Image output can be either to
hardcopy or digital file (a large variety of file formats are supported
including TIFF, JPEG, GIF, and many others).